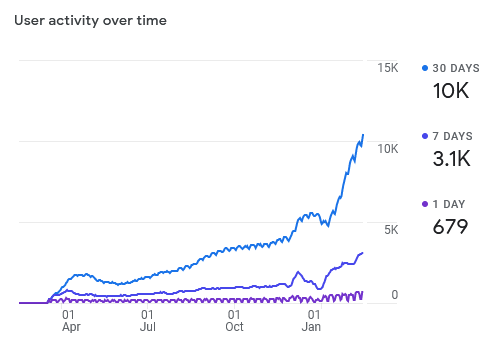
It’s clear that something is happening somewhere. We are getting a lot of additional traffic in the last two months. This doesn’t have anything to do with my recent post, the date of the up-tick starts in early December 2021, and appears to have shifted gears Jan 10. There’s usually some event that causes inflection points like this, and I’d be willing to bet it has to do with the “you are no longer a member” email.
Your post made me think of this.
<LINK_TEXT text=“https://www.youtube.com/watch?v=FOQPMjK … rt_radio=1”>https://www.youtube.com/watch?v=FOQPMjKLQQU&list=RDFOQPMjKLQQU&start_radio=1</LINK_TEXT>
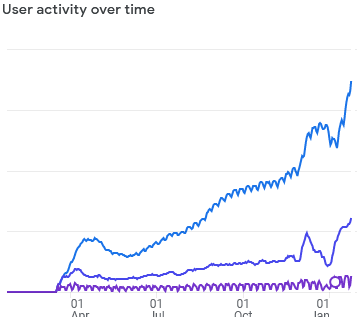
Please forgive my ignorance, but there’s no legend, I don’t know what I’m looking at.
You can just think of it as activity over time. The time scale is at the bottom. Each data point represents activity for a given day. The bottom purple plot is daily activity, as you can see it has a weekly cycle, with activity being low on the weekends. The middle plot is weekly activity, and the top plot is monthly.
And I’m sure the address by Steve Billeter at 3DXworld regarding this forum vs. the Swymp won’t hurt those numbers. I still can’t believe that’s actually happening.
I’m not sure what happened the first week of the year, but that’s an interesting anomaly in the data.
image.png
They were circling back on the issues that they had. ![]()
If you look real close it spells Covid, or Omicron.
I guess that there exists even a talk at 3dx world about this forum has some influence on this.
That’s just us rehashing 3DX face palm moments over and over…never gets old apparently.
Plus, there are always traffic dips around holidays for professional topic sites. The SW announcement about end of online licensing.
And then it hits me SPerman is talking about the funky circle. Yeah, graphics glitches even hit Google the Great.
The controversy over the Billeter presentation seems to keep driving activity.
The Billeter Event of '22